

In the market analysis I read, the prevailing view seems to be that the Head and Shoulders pattern is always a reversal pattern, and its completion is inevitable. However, this is not true. Head and Shoulders often form what is called a continuation pattern, or consolidation. My view over the last couple of months has been that the market is experiencing a mini-rotation from growth and momentum stocks to large cap value stocks. However, if you take a step back from that view, the market is largely in a consolidation phase after the 2013 rally. This remains true today. If the economy shows further improvement, investors will have no choice but to take notice.
As mentioned earlier, a head and shoulders pattern is not necessarily a reversal pattern forming a top and bottom. It can also be a continuation formation. It may simply be a consolidation unless the pattern completes with a break of the neckline. The break should be confirmed by a 1-3% move, and these breaks are usually retested.
Here, in 2010, the S&P 500 completed an H&S top, dropping below 1050 to 1025. This was a 2.3% move. However, on the retest, the index failed to stay below the neckline and became a bear trap.

The recovery wasn't over, it just needed a little break. After the flash crash in May, investors were pretty spooked. But it didn't trigger another bear market, and the market recovered along with the economic data. The economic data in the first quarter of 2011 was the strongest of the recovery to that point.

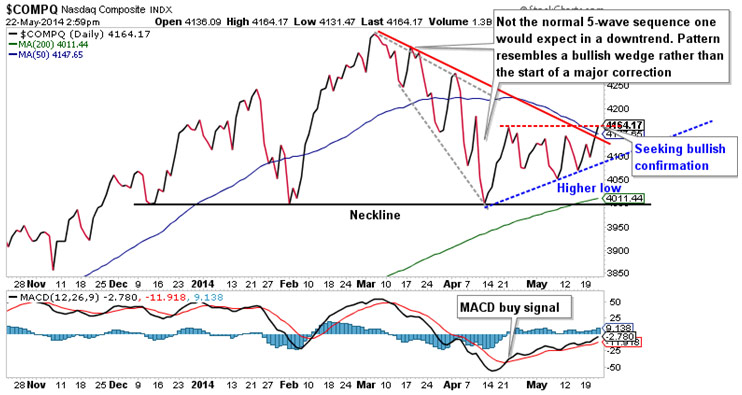
The head and shoulders pattern on the Nasdaq Composite Index has been much discussed in the past. As things stand, the neckline near the February lows has held as support and is still holding for now. Interestingly, the downtrend since the March high has broken down and the medium-term trend is on the verge of confirming a new uptrend if the index can close above 4162 on a closing basis. The MACD reversed in late April. Today, the Nasdaq is poised to close above its 50-day moving average, another positive development.
It's not enough for the Nasdaq Composite to simply rise above its 50-day moving average; a majority of the stocks within the index need to do the same. Currently, 33% of the Nasdaq Composite is trading above its 50-day moving average. This is up from 24% on May 8th, suggesting it may be coming out of a month of oversold conditions. This number needs to continue to rise from here, which would likely happen if the Nasdaq can break above the short-term resistance (mentioned above).
Percentage of Nasdaq stocks above their 50-day moving average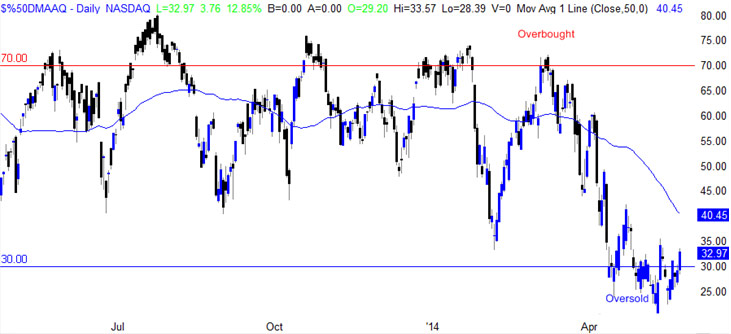
The Wilshire 5000 Composite is a composite I've been watching lately with all the small vs large cap confusion. The Wilshire 5000 is a full cap index. So, what does a composite of 5000 companies tell us, without worrying about market cap? Answer: The market has been consolidating in a sustained uptrend. So far, there are no signs of the trend reversing, especially as long as the long term trend continues to rise and support this market.

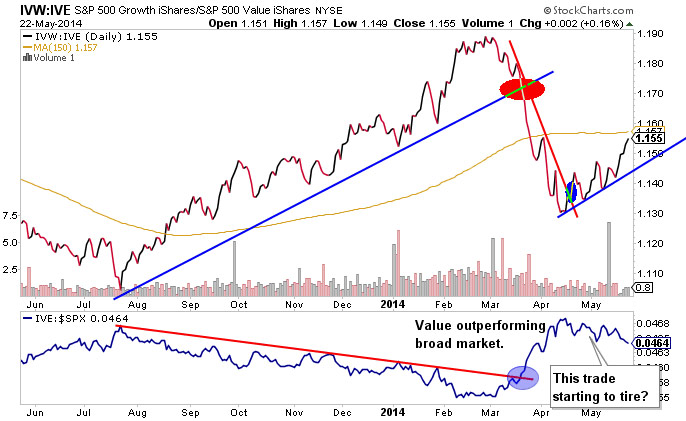
A few weeks ago I mentioned that the value vs. growth stock trade may be reversing, and over the past two weeks, further evidence has continued to emerge that this may be the case.
One of the reasons I have remained bullish over the past two months, despite the rotation out of momentum stocks into value and large cap stocks, is that economic conditions have been steadily improving: the Leading Economic Indicator (LEI) has continued to rise despite the winter correction, reaching a new high today.

Source: businesscycle.com
If the LEI had reversed here, I would be more inclined to believe that a significant pullback and correction was likely. As you can see from the chart above, this is not the case. In fact, growth rates are rising in both the LEI and the Coincident Index, with the Coincident Index showing the “now” situation. So, if tomorrow's and today's numbers show good things to come in your future, that's probably a good thing.
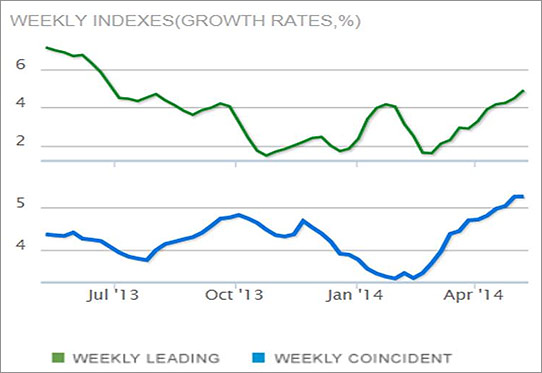
Source: businesscycle.com