

U.S. Gross Domestic Product (GDP) growth in the current business cycle likely peaked in mid-2018, supported by the Tax Cuts and Jobs Act of 2017 and the 2018 U.S. federal budget deal. Following tax reform, GDP reached 4.2% in June 2018 and has since decelerated towards its long-term trend rate of 1.8%.
By our estimates, the economic effects of the tax cuts peaked in October 2018 and are now fading. The budget agreement still provides net support to overall economic activity, which will be reflected in GDP in early 2019, aided by the public construction sector, which rose 3.7% in February. However, if a bipartisan budget agreement is not reached by the end of 2019, the U.S. economy faces a fiscal cliff of $126 billion in FY20 that would begin to drag on overall growth in the second half of 2019.
As the U.S. economy heads toward the end of its current business cycle, studying leading indicators of economic activity can provide important insights for mid-sized business executives, investors, and policymakers looking to the future.
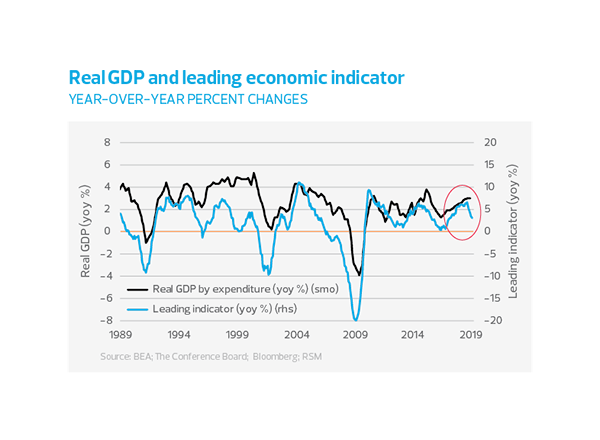
Most notable of these is The Conference Board's monthly Leading Economic Index® (LEI), a composite index of 10 economic and financial indicators that have historically preceded turning points in the U.S. economy. Currently, the LEI suggests that GDP growth peaked in the third quarter of 2018.
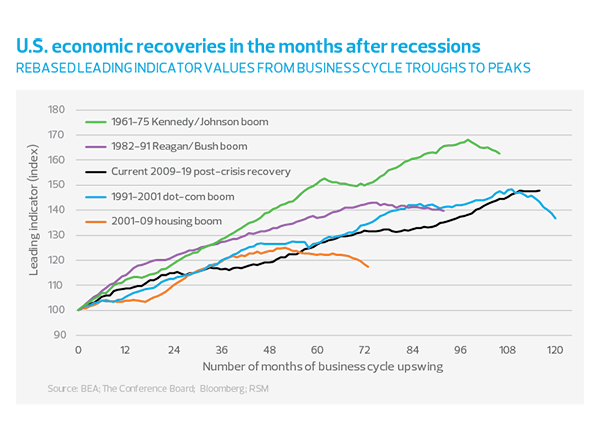
Recessions (and recoveries) are determined by the National Bureau of Economic Research to mark the peaks and troughs of the business cycle and do not follow the convention of defining a recession as two consecutive quarters of negative growth. However, the performance of the Conference Board's LEI suggests that the economic recovery since the Great Recession of 2007-2009 is second only to the rise of the so-called dot-com boom cycle of the 1990s, which ended with the collapse of the bubble in the 2000 recession.
Deceleration Index
As the chart below shows, business cycles are not always smooth. Events and price shocks such as the impact of the Fukushima nuclear disaster in 2011 on global supply chains, the spillover effects of the European debt crisis in 2010-2012, and the collapse of global oil prices in 2015 can create intermediate peaks and troughs in the long-term trend of GDP growth.
To forecast the risk of a local peak turning into a full-blown downturn, we created a deceleration index based on the economic and financial components of the Conference Board's LEI. If a component has improved from the previous month, it is assigned a value of 1, and if it has worsened, a value of -1. Indicators showing no change are assigned a value of 0. The index is equal to the average of the assigned component values and is reported as a percentage. Note that lows in the deceleration index forecast mid-term business cycle troughs.
Ten of the Conference Board's indicators for the third quarter of 2018 worsened in October. From construction and manufacturing indicators to interest rate and credit expectations and consumer confidence, not since the Great Recession have so many indicators worsened at the same time.
The deceleration index captures the sharp decline in overall economic activity that began in the third quarter of 2018 and has yet to stabilize. While soft data such as purchasing managers' sentiment show tentative signs of stabilization, hard data have yet to show sustained stabilization. Given the adverse impact on data collection of the U.S. government shutdown from December 22 to January 25, stabilization may not be seen until mid-2019.
Components of Leading Indicators
Labor market
Weekly work hours
Average weekly hours worked in manufacturing have declined intermittently since April 2018, suggesting either an increase in the labor pool or a slowing economy and a reduced need for overtime.
unemployment
Initial claims for unemployment insurance are not falling as rapidly as they did earlier in the recovery, but the nature of the relationship between the unemployment rate and the business cycle suggests that more data is needed to confirm the existence of a trend.
As the U.S. economy heads toward the end of its current business cycle, studying leading indicators of economic activity can provide important insights for mid-market executives, investors, and policymakers looking to the future.
Consumer Sector
Building Permits
Although residential construction has picked up since mid-2016, the growth rate of home purchase approvals has started to decline again, reflecting household caution (see below), an ageing population, and generational changes in housing preferences. Either way, this decline does not bode well for further economic growth.
Consumer sentiment
Although consumer sentiment improved significantly during the economic recovery, household expectations about business and economic conditions ultimately plateaued and then worsened in the fourth quarter of 2018.
By our estimates, the economic benefits of the tax cuts peaked in October 2018 and are now fading.
Manufacturing
New Orders Purchasing managers have reported a deterioration in new manufacturing orders since March 2018, which unfortunately could signal longer-term implications for economic growth.
New orders for consumer goods manufacturing appear to have declined in the third quarter after nine months of increases, which is linked to the various trade disputes the United States is currently involved in and the slowdown in global economic growth that accelerated in the second half of 2018.
New orders for capital goods (excluding aircraft) manufacturing have been trending downward throughout 2018, possibly indicating the impact of the Administration's tariff policies.
Financial Sector
Credit Terms
Credit conditions remain favorable as markets continue to respond to the Federal Reserve's still-accommodative lending rate policy, although senior bank lenders report that lending requirements for commercial and industrial loans are tightening.
Stock Market Performance
The stock market is not the best predictor of overall economic growth. For the half of the population that invests in the stock market, the wealth effect from this fall's stock market crash was largely reversed by January's rally, but the extreme damage it did to nearly everyone's emotions is unlikely to be reversed anytime soon. As the crash demonstrated, there were too many policy inconsistencies for the boom to continue. And the stock market is unlikely to remain the sole source of revenue any time sooner than it did during the period of low and long interest rates that characterized the decade-long economic recovery.
Yield Curve
The Conference Board notes that an inverted yield curve is a good indicator of an upcoming recession, and that the relative value of market values of long-term interest rates to policy-set short-term interest rates reflects the perception of growth in the near term and beyond. Given current financial conditions, we believe the yield curve is fake and a recession is not imminent.